Plotting spatial objects is always a pain in the… somewhere.
With the help of contextily, it will make the job easier.
Please find some sample codes and plotting results below:
import contextily as ctx
import matplotlib.pyplot as plt
import geopandas as gpd

# roads_df represents a road network dataframe which is a
# loaded GeoDataFrame object with a geometry column
#
# .to_crs(epsg=3857) is to change the project reference system
# that the base map module requires
roads_df = roads_df.to_crs(epsg=3857)

fig, ax = plt.subplots()
ax.set_aspect('equal')

roads_df[roads_df.touches(roads_df.iloc[0]["geometry"]) | roads_df.intersects(roads_df.iloc[0]["geometry"])].plot(figsize=(20, 20), color='red', ax=ax)
roads_df.loc[[0], "geometry"].plot(figsize=(20, 20), color='green', ax=ax)

# Here adds the base map under the plotted GeoDataFrame
ctx.add_basemap(ax)
plt.show()
roads_df represents a road network DataFrame which is a loaded GeoDataFrame object with a geometry column.
.to_crs(epsg=3857) is to change the project reference system that the base map module requires.
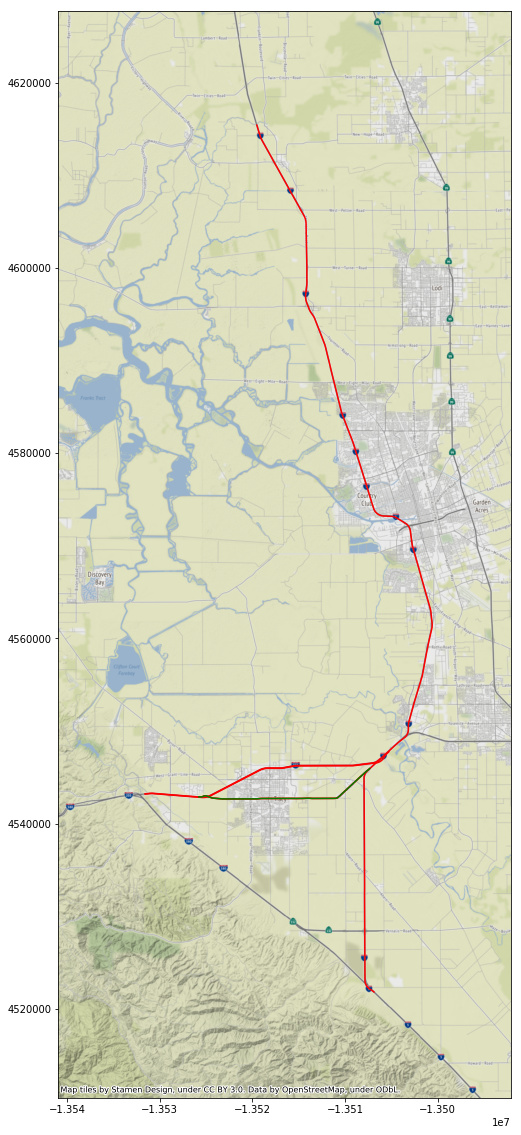
Here is the resulting plot:
Please feel free to let me know if you have any further questions!
Best,
Kaiqun